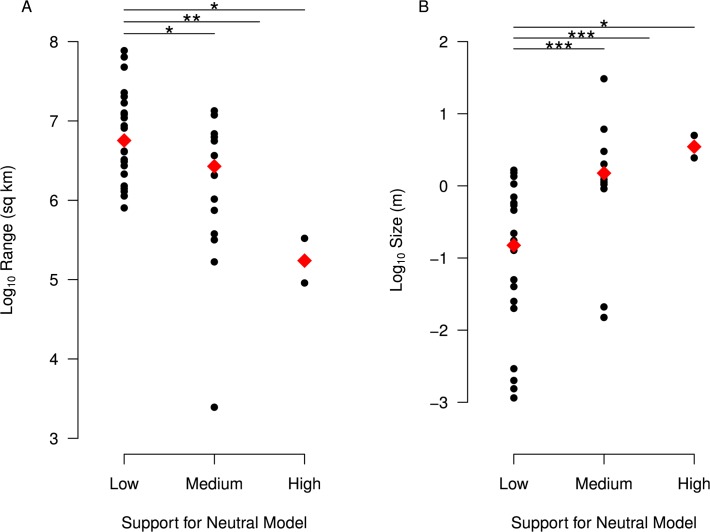
Fig 4. Species with little evidence for selection have smaller census sizes.
For each species, we estimated the relative likelihood of a purely neutral model (no impact of selection on neutral diversity), based on AIC values for neutral and selection models (see methods for details) and categorized species based on support for neutrality (low = relative likelihood < 0.05, medium = relative likelihood ≥ 0.05 but < 0.9, high = relative likelihood ≥ 0.9). Species with more support for neutrality have smaller ranges (part A) and larger body size (part B). p-values for comparisons (indicated by lines at the top of each panel) of low versus high; low versus medium; and low versus medium and high combined are based on Wilcoxon Rank Sum tests (*** p < 0.001, ** p < 0.01, * p < 0.05). Raw data underlying this figure can be found in S2 Data.

