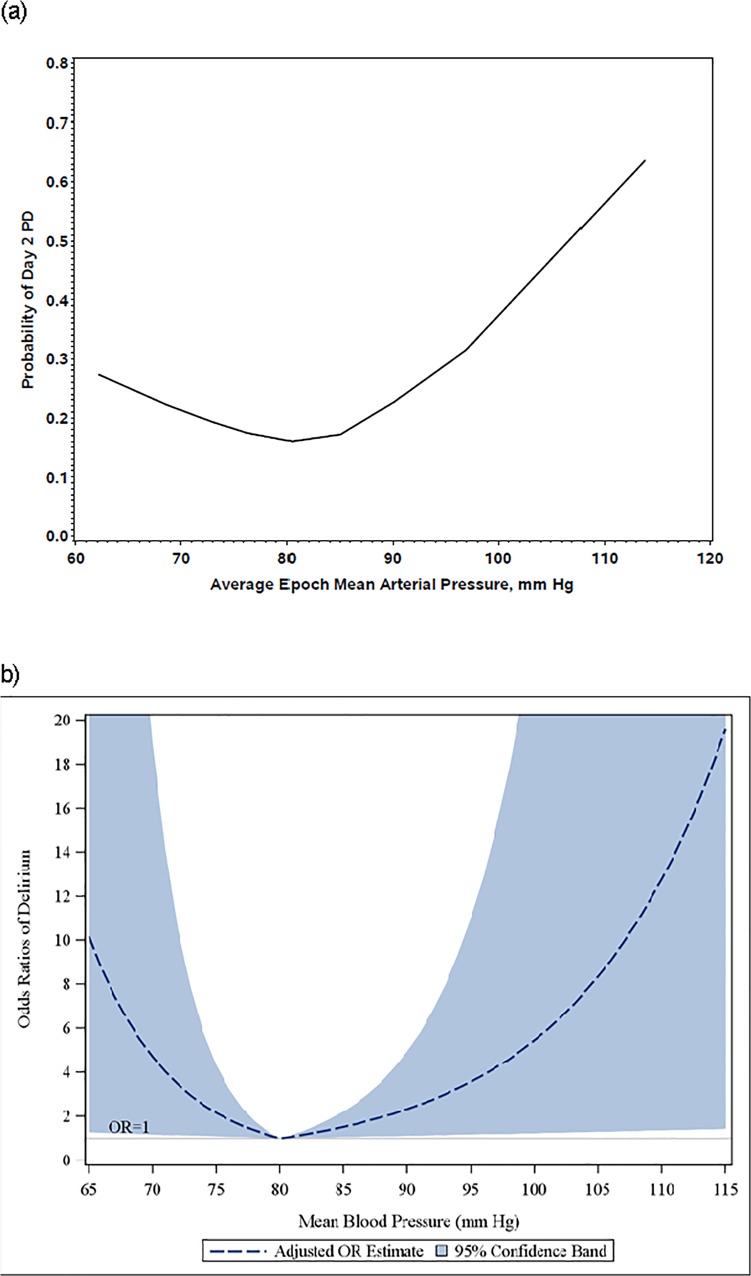
Fig 1. Delirium risk on postop day2 and msMAP.
a: Nonparametric LOESS plot of delirium risk on postop day 2 and msMAP. The x-axis denotes the msMAP. The y-axis denotes the risk of delirium on postoperative day 2. b: Adjusted odds ratios of delirium risk on postop day 2 on msMAP after adjustment for age, preoperative cognitive impairment, corresponding BP value at baseline, trial intervention received, Charlson co-morbidity index score, duration of surgery, and unit of RBC transfusion. The x-axis denotes the msMAP. The y-axis denotes the model-based odds ratio of delirium on postoperative day 2.

