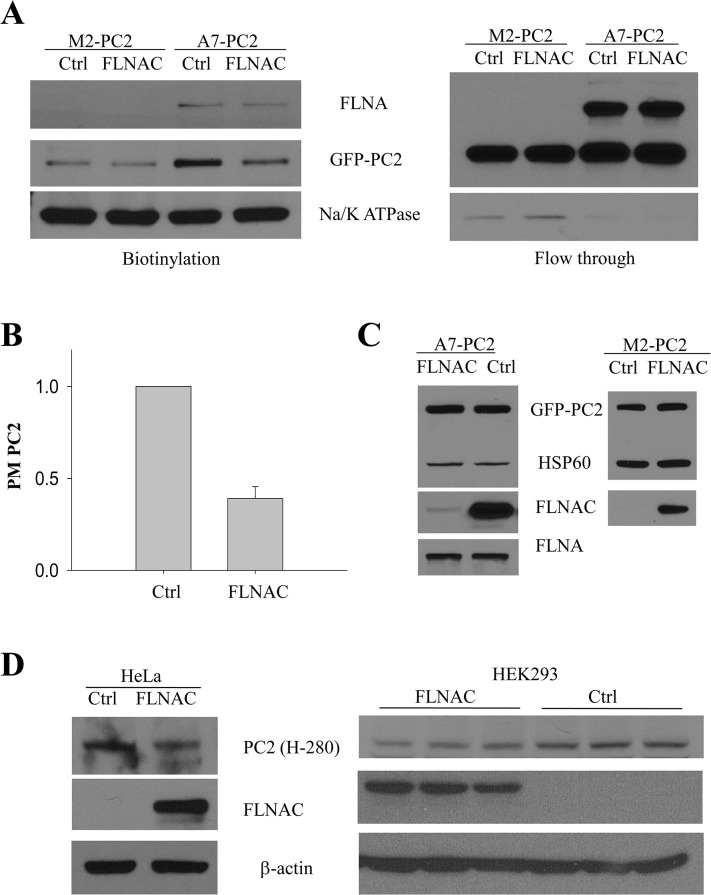
Fig 5. Effect of FLNAC on the surface and total PC2 expression.
A, representative biotinylation data showing the effect of FLNAC on the PM (biotinylation) and intracellular (FT) GFP-PC2 expression in M2 and A7 cells. B, averaged PC2 PM expression in A7 cells showing the effect of FLNAC over-expression. FLNAC reduced PC2 PM expression to 46% ± 12% (N = 3; p < 0.001) of the control level. C, representative data showing the effect of FLNAC on the total PC2 expression in GFP-PC2 stably expressing A7 (left panel) (N = 3; p = 0.01) and M2 cells (right panel) (N = 3; p = 0.16). HSP60 was used as a loading control. D, WB data showing the effect of FLNAC on the endogenous PC2 level in HeLa (left panel), HEK293 (middle panel) and IMCD (right panel) cells detect by antibody H-280. β-actin was used as a loading control (N = 3).

