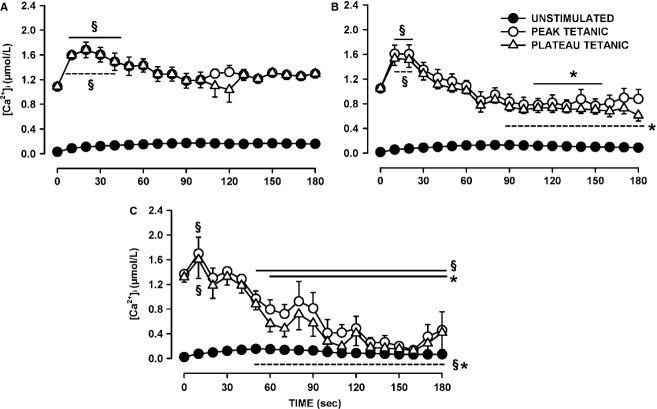
Figure 4.
Changes in unstimulated, peak, and plateau tetanic [Ca2+]i during fatigue among wild-type control fibers. Fibers were separated into three groups: (A) fibers for which plateau tetanic [Ca2+]i at the end of fatigue was greater than the prefatigue value (n = 5); (B) fibers for which the final decreases in plateau tetanic [Ca2+]i were <0.5 μmol/L (n = 8); (C) fibers for which the decreases exceeded 0.5 μmol/L (n = 5). See Figure8 for a better resolution in unstimulated [Ca2+]i between fiber groups. §Mean peak (solid line) or plateau (dashed line) tetanic [Ca2+]i was significantly different from the prefatigue mean value (Time 0 sec). *Mean peak or plateau tetanic [Ca2+]i was significantly different from the mean value for the fibers in A, ANOVA, and L.S.D. P < 0.05.

