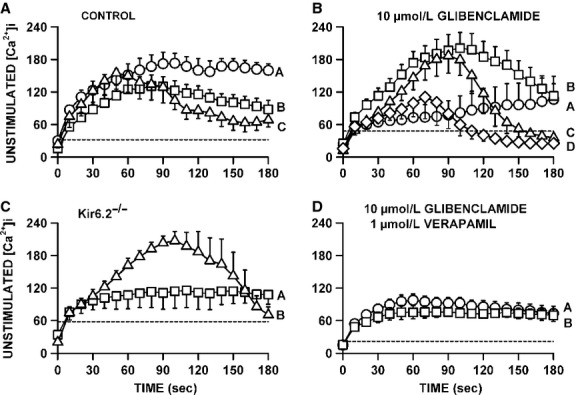
Figure 8.

Verapamil significantly reduced the increase in unstimulated [Ca2+]i when KATP channels are blocked with 10 μmol/L glibenclamide. (A) Changes in unstimulated [Ca2+]i during fatigue for the three groups of control fibers as shown in Figure5A–C; (B) the same for glibenclamide-exposed fibers as shown in Figure6A–D, (C) for Kir6.2-/- fibers in Figure7A–C and (D) for glibenclamide–verapamil-exposed fibers in Figure8A and B. Vertical bars represent the SE of the number of fibers as indicated in Figures8. Dashed horizontal line indicates the level at which unstimulated [Ca2+]i was significantly greater than the prefatigue level.
