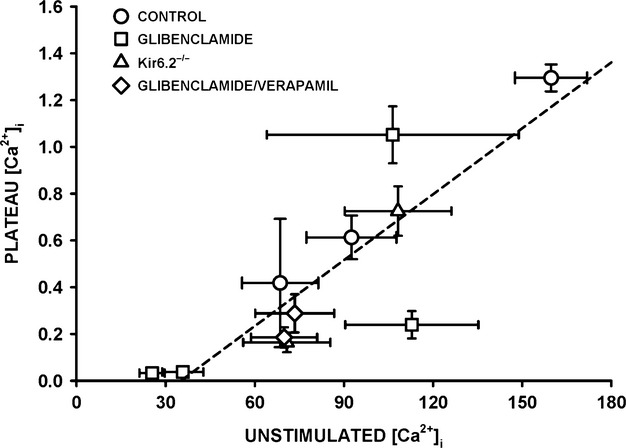
Figure 9.

Relationship between plateau and unstimulated [Ca2+]i at the end of fatigue. Mean plateau [Ca2+]i (from data at 180 sec of each fiber group in Figs.7) were plotted against mean unstimulated [Ca2+]i (from the data at 180 sec of Fig.8). Dashed line is the regression line with a R value of 0.848.
