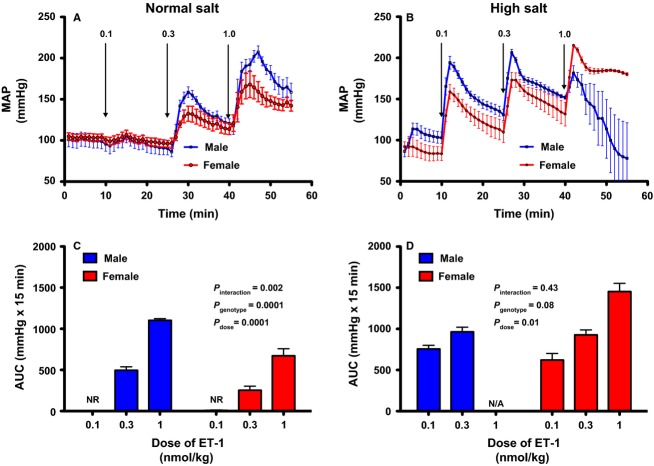
Figure 3.
Comparison of MAP in response to intravenous bolus of increasing doses of ET-1 (0.1, 0.3, and 1.0 nmol/kg). Panels (A and C) represent MAP tracings from male and female (n = 3–5) ETB def rats maintained on NS or HS diet, respectively, for 3 weeks. (B and D) represent the AUC after ET-1 infusion calculated from the baseline. Data expressed as means ± SE.

