
Figure 4.
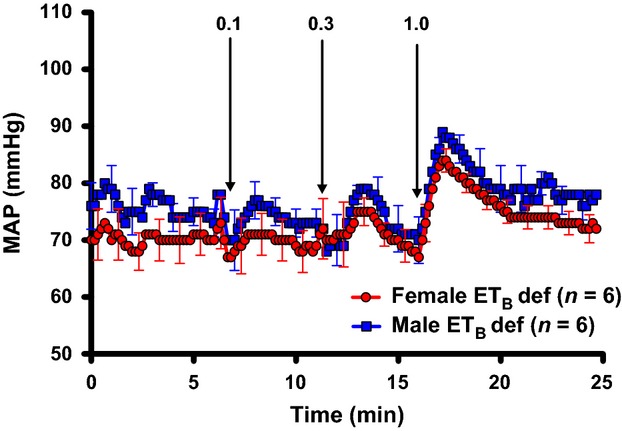
Comparison of MAP in response to increasing doses of S6c (ETB agonist) in male and female ETB def rats on NS diet. Data expressed as means ± SE.
Official websites use .gov
A
.gov website belongs to an official
government organization in the United States.
Secure .gov websites use HTTPS
A lock (
) or https:// means you've safely
connected to the .gov website. Share sensitive
information only on official, secure websites.
Comparison of MAP in response to increasing doses of S6c (ETB agonist) in male and female ETB def rats on NS diet. Data expressed as means ± SE.