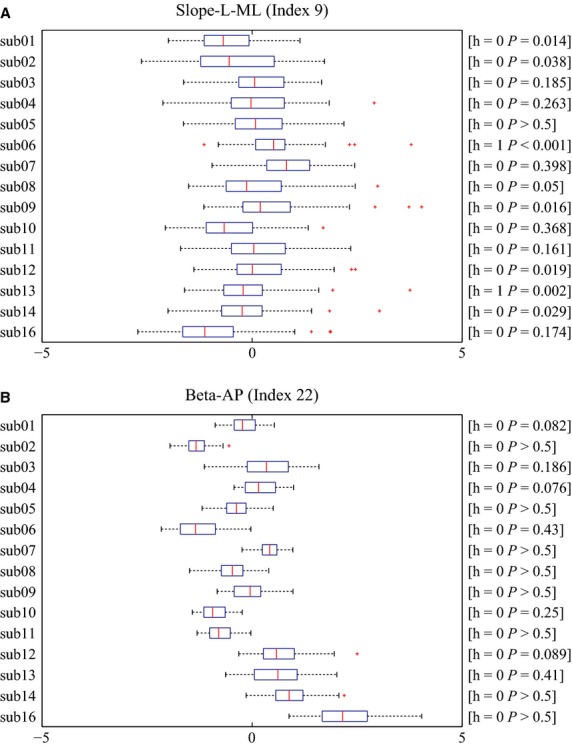
Figure 3.

Box-plot of every subject for (A) Slope-L-ML (Index 9) and (B) Beta-AP (Index 22). (A) Slope-L-ML (Index 9) was normally distributed in most of the subjects. h and P-values for each panel represent the results of Lilliefors' test examining the null hypothesis that the data comes from a normal distribution. h = 1 if the test rejects the null hypothesis at 1% significance level, and h = 0 otherwise. The individual means of Slope-L-ML index for all subjects were close to each other, which made the individual variances relatively large. (B) Beta-AP (Index 22) was also normally distributed in all subjects. The individual means of Beta-AP index were largely subject-dependent, which made the individual variances relatively small.
