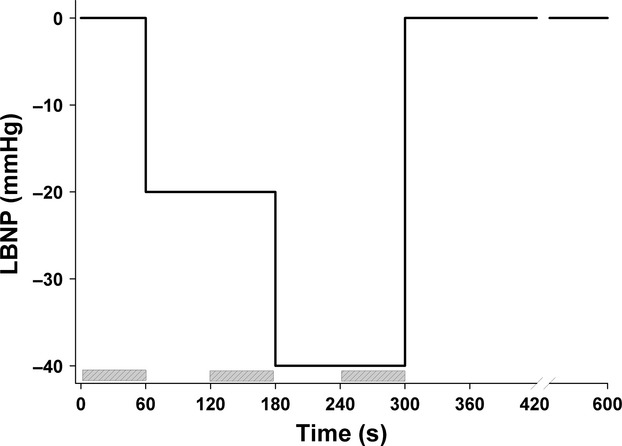
Figure 1.

Schematic overview of the experimental setup showing different levels (y-axis) and duration (x-axis) of preload reduction by lower body negative pressure (LBNP) in one of the eight experiments performed in each of the 12 subjects. The time period of the echocardiographic recordings is drawn with marked boxes.
