
Figure 2.
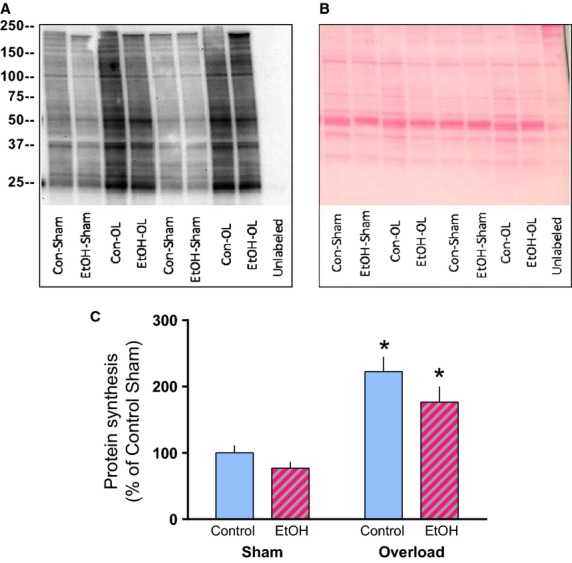
Overload increases protein synthesis in control and alcohol-fed mice. Puromycin was injected 30 min prior to tissue collection and a representative image of the Western blot (A) and the corresponding Ponceau S stained membrane used to verify loading (B) is shown. Treatment groups are labeled beneath each lane (Control, n = 10; EtOH, n = 10). (B) Quantification of the Western blot image expressed as a percentage of the Control-Sham condition. *P < 0.05, indicates statistical difference from the corresponding Sham condition. Values are expressed as means ± SE.