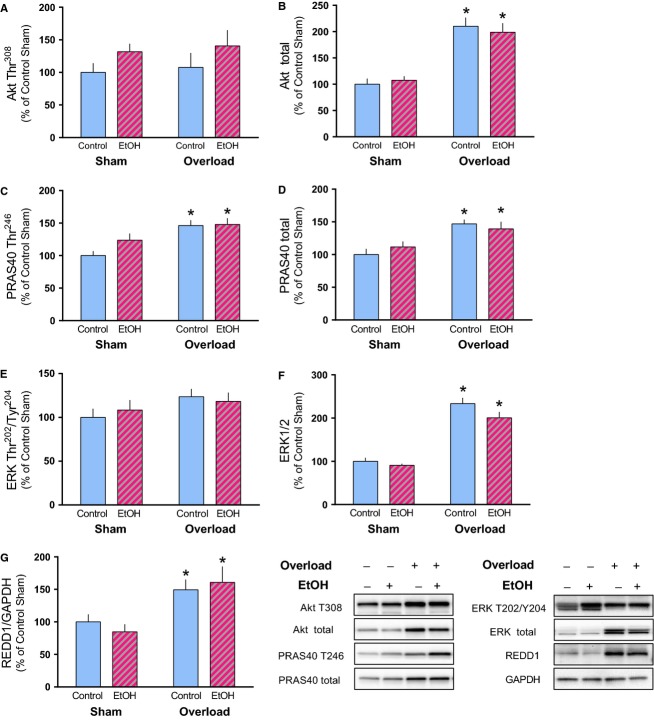
Figure 5.
Expression of proteins upstream of mTORC1 was not differentially altered by alcohol in response to muscle overload. The relative amount of phosphorylated and total Akt (A, B), PRAS40 (C, D), ERK (E, F), and REDD1 (G) were measured in the plantaris muscle after 14 days of muscle overload. Representative images are shown corresponding to the sample order presented graphically. *P < 0.05, indicates significant difference from Sham condition within that treatment. Values are expressed as means ± SE.

