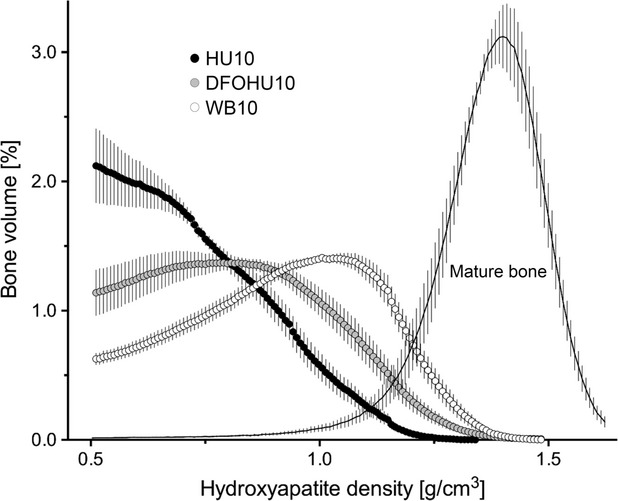
Figure 4.

Relative distribution of bone volume versus density of hydroxyapatite (d.HAp) within the defect region from HU10, DFOHU10, and WB10. The d.HAp distribution in the intact diaphyseal cortical segment over all three groups is also shown. The bone volume at each d.HAp value (bin width: 8 mg/cm3) is expressed as a percentage of the total volume of voxels where d.HAp is >500 mg/cm3. Values are mean ± SEM.
