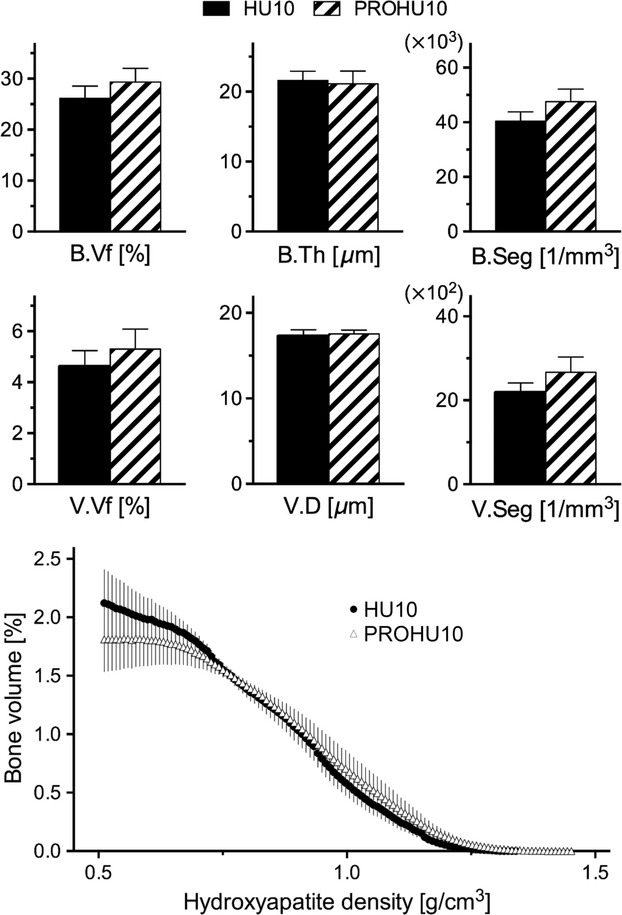
Figure 5.

No differences were found between HU10 and PROHU10 in bone and vascular volume fractions (A), bone thickness and vascular diameter (B), bone and vessel segment densities (C), or the relative distribution of bone volume versus d.HAp (D), shown in the same manner as in Fig.4. Bars represent mean ± SEM.
