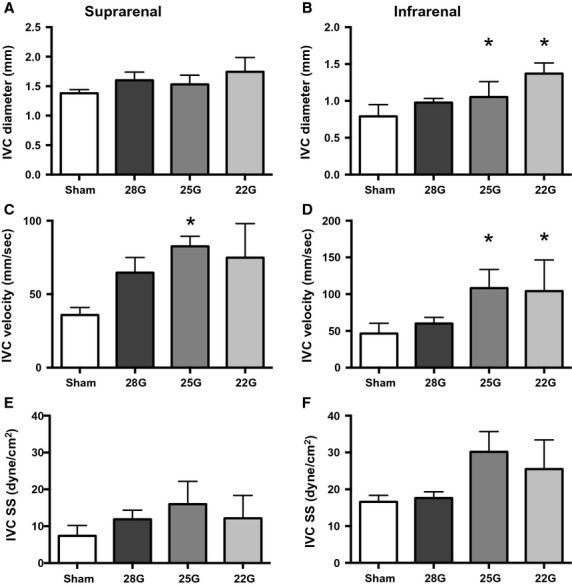
Figure 5.

Ultrasound measurements in the IVC distal to the fistula. Ultrasound derived measurements in the suprarenal (left column) and infrarenal (right column) IVC; diameter (A,B), velocity (C,D), and calculated SS (E,F). In all graphs, n = 7 for shams and 5 for the fistulae groups. ANOVA results: A, P = 0.38; B, P = 0.0001; C, P = 0.05; D, P = 0.0012; E, P = 0.07; F, P = 0.15. For all figures, *denotes P < 0.05 compared to sham group, post hoc test.
