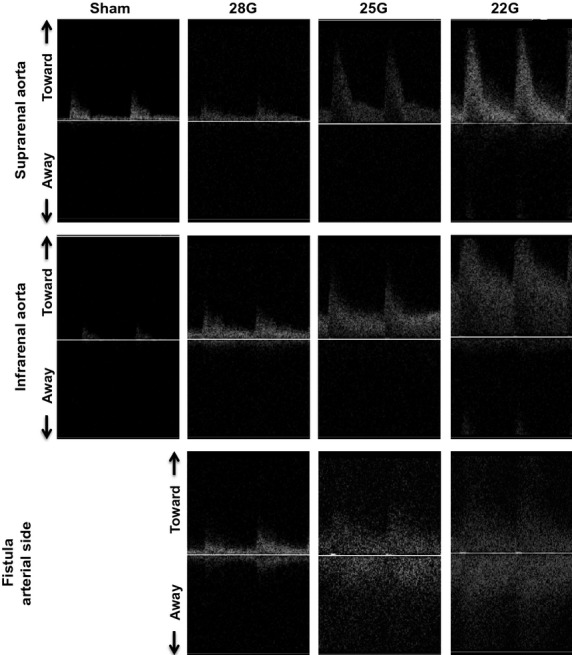
Figure 6.

Aortic waveforms after AVF. Representative waveforms observed using Doppler ultrasound in the suprarenal aorta (first row) and the infrarenal aorta (second row) proximal to the fistula, as well as in the aorta at the level of the fistula (third row). First column, sham procedure; second column, 28G fistula; third column, 25G fistula; fourth column, 22G fistula. The presence of a wide range of frequencies at each time point is characteristic of disturbed flow.
