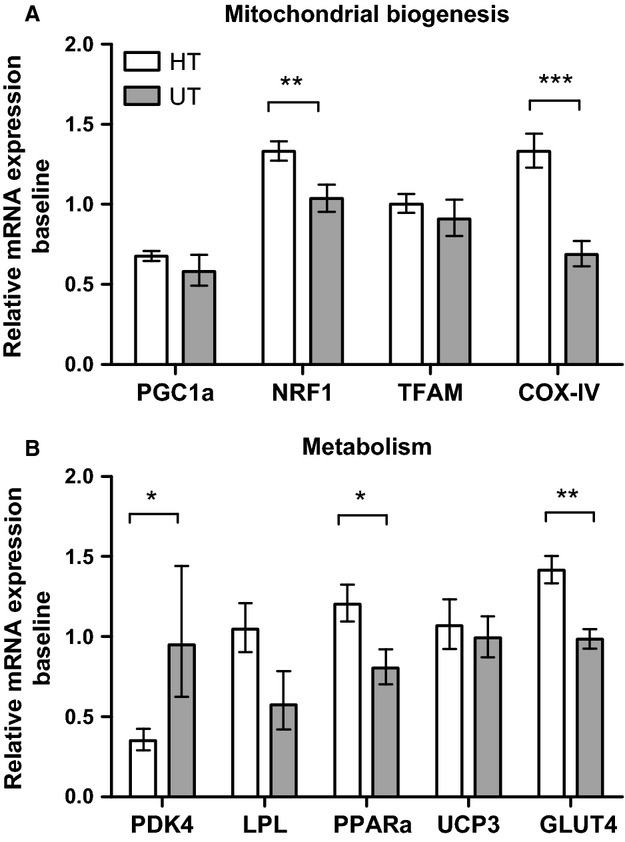
Figure 2.

Baseline mRNA expression levels of HT vs. UT. Expressions levels of targets related to mitochondrial biogenesis (A) or metabolism (B). Values are normalized to the reference genes GAPDH and RPLP0, and reported as geometric means ± SEM. HT; n = 15, UT; n = 8. Significantly different from UT; *(P < 0.05), **(P < 0.01), ***(P < 0.001).
