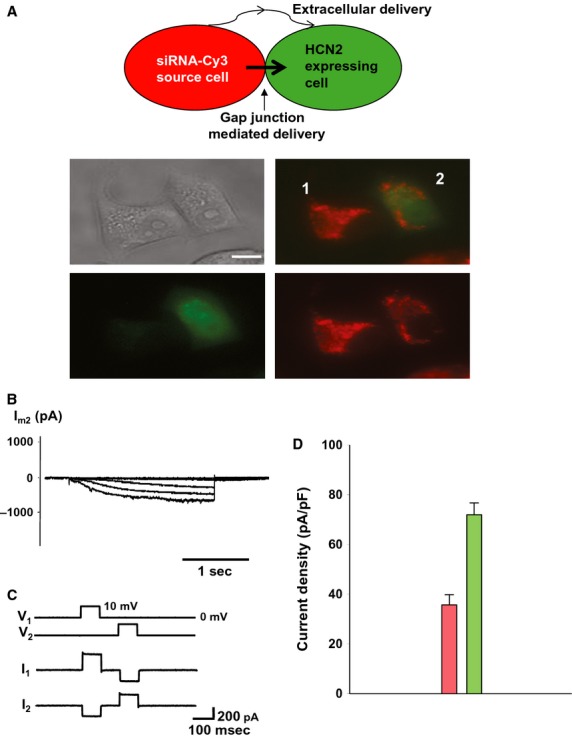
Figure 2.

Cell-to-cell transfer of siRNA. (A) Schematic in the upper panel illustrates experimental conditions. Middle panel: cell 1- HeLaCx43 cell transfected with siRNA Cy-3 (red), cell 2- recipient cell transfected with mHCN2 gene and eGFP (green). After 24 h in coculture red-labeled siRNA Cy-3 can be detected in the recipient cell (green) of the pair (lower panel). Scale bar, 10 μm. (B) Im elicited in cell 2 (green) showed inhibited HCN2 currents. (C) Voltage steps (10 mV, 50 ms) applied to cell 1- and cell 2-induced currents in the cell pair above showing gap junction coupling of gj = 22 nS. (D) Averages of current densities measured from single control cells (green bar: 71.9 ± 4.7 pA/pF, n = 54) and cells from the pair with siRNA-transfected cells (pink bar: 35.7 ± 4.1 pA/pF, n = 51), P < 0.001.
