Figure 6.

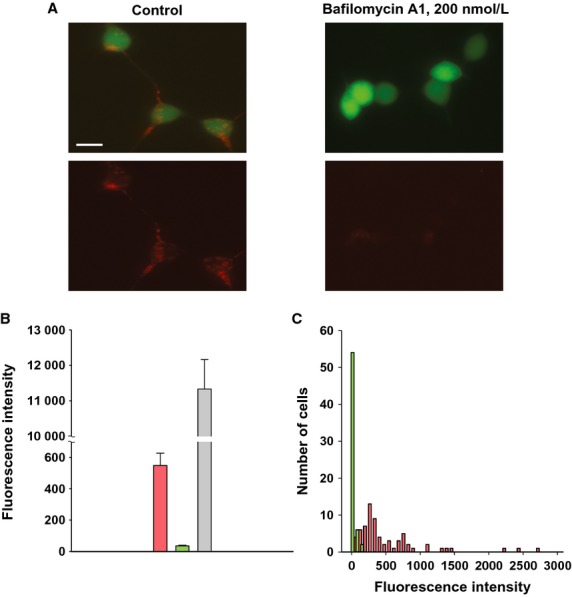
Extracellular transfer efficiency. (A) HEK293/HCN2 cells incubated in conditioned medium for 24 h. Left panel: in control cells typical vesicular accumulation of siRNA Cy-3 resulted in a bright red fluorescence staining in perinuclear region (bottom). In the presence of 200 nmol/L Bafilomycin A1 (right panel) very weak siRNA Cy-3 accumulation was observed. (B) Average of siRNA Cy-3 fluorescence intensity measured from control HEK293/HCN2 cells in conditioned medium (pink bar, 549.1±78.3, n = 69), and cells incubated with Bafilomycin A1 (green bar, 35.8 ± 4.3, n = 62), P < 0.001. For comparison gray bar represents fluorescence intensity average from siRNA-transfected cells (11133.2 ± 831.1, n = 12). (C) Histograms of siRNA Cy-3 fluorescence intensity gained from cells incubated in conditioned medium without bafilomycin (pink histogram) and in presence of 200 nmol/L Bafilomycin A1 (green histogram). The number of observations (cells) was plotted versus red fluorescence intensity.
