
Figure 7.
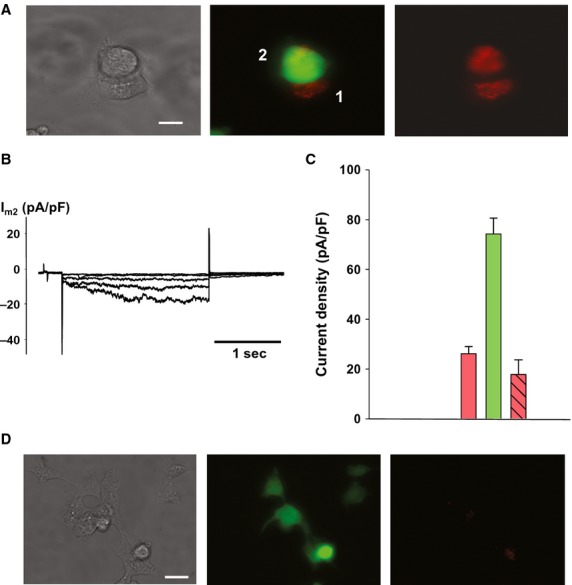
Morpholino transfer. (A) HEK293 cell pair where cell 2 is expressing eGFP and HCN2 and the cell 1 has been transfected with a red-tagged morpholino targeting HCN2. (B) Typical Im recording from a recipient cell of a pair, indicating inhibited HCN2 currents (gj = 14 nS). Scale bar, 10 μm. (C) Summary plot of HCN2 currents recorded from HEK293/HCN2 cells. Green bar: single control cells (74.3 ± 6.3 pA/pF, n = 43); pink bar: single cells transfected with morpholino (26.2 ± 2.8 pA/pF, n = 50); striped pink bar: recipient cells of a pair (17.8 ± 5.9 pA/pF, n = 5); P = 0.473. (D) HEK293/HCN2 cells cultured for 24 h in conditioned media obtained from morpholino-transfected HEK293 cells. No significant morpholino transfer via the extracellular space is observed. Scale bar, 20 μm.