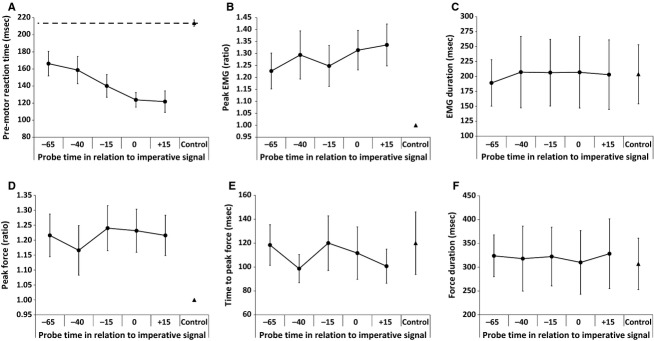
Figure 1.

Mean data (SEM error bars) from the replication analyses, including EMG and force measures based on acoustic probe times. Probe trials are represented by circles, while the control data are represented by a triangle. Note the significant linear decrease in premotor reaction time (panel A) and linear increase in peak EMG (panel B) as the probe time approaches the imperative signal.
