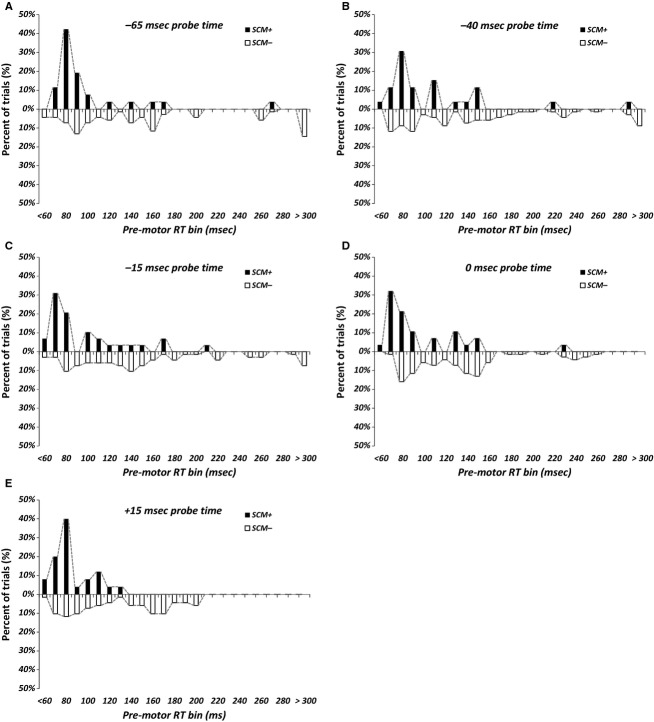
Figure 4.
Premotor reaction time (RT) distribution in 10 ms bins, separated by those trials with SCM activation (SCM+, black bars) and without SCM activation (SCM−, white bars), for each probe time (panels A through E). Note that for SCM+ trials, the majority of RT distribution lies in the 60–100 ms range (indicative of response triggering), while SCM− trials show a greater distribution in the 100–300 ms range (indicative of voluntary initiation processes).

