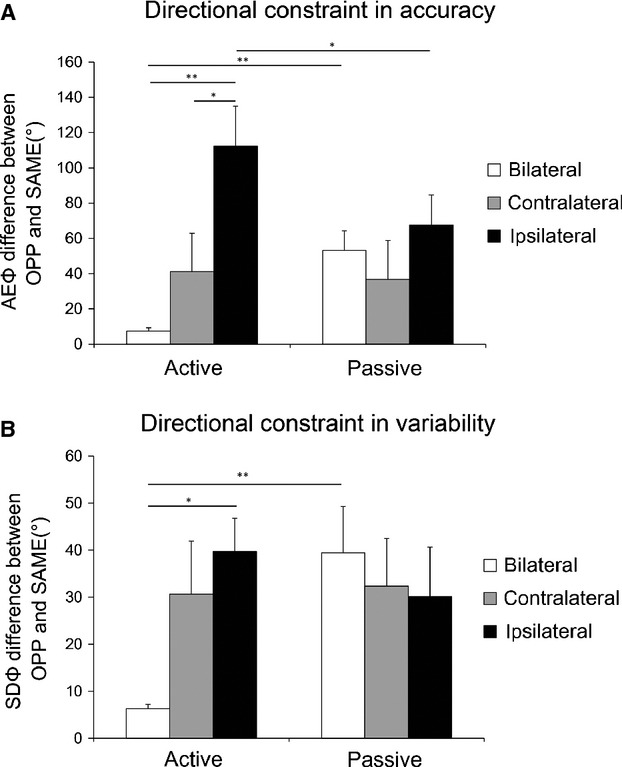
Figure 3.

Difference in the directional constraint. The difference between the performances of OPP and SAME in accuracy (AEΦ) (A) and variability (SDΦ) (B) were shown as degrees of the directional constraint. Asterisks indicate significant differences detected by Wilcoxon signed rank test. In every graph, white bars indicate the data of bilateral, gray is contralateral, and black represents ipsilateral combination. Values are expressed as mean ± SE.
