
Figure 1.
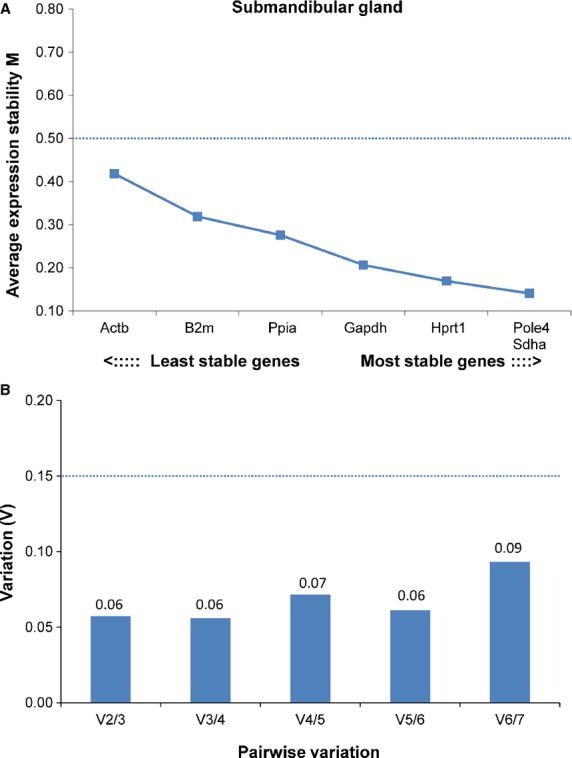
Gene expression stability and pairwise variation of the candidate reference genes for accurate normalization in submandibular gland. (A) The chart generated by geNorm indicates the average expression stability value (M) of reference genes at each step during stepwise exclusion of the least stable expressed reference gene. Starting from the least stable gene at the left, the genes are ranked according to increasing expression stability, ending with the two most stable genes on the right. In this analysis, Pole4 and Sdha were the two most stable genes. (B) The second chart then guides the optimal number of reference genes. The process of determining “pairwise variation V” begins with the two most stably expressed genes on the left, followed by the inclusion of a 3rd, 4th, 5th gene, etc. moving to the right. A V score of below 0.15 (marked with a dashed line) is considered ideal, and use of the two most stable genes alone (Pole4, Sdha) was sufficient to obtain a V score of 0.06 which was not improved by the addition of a third gene (V3/4 = 0.06).