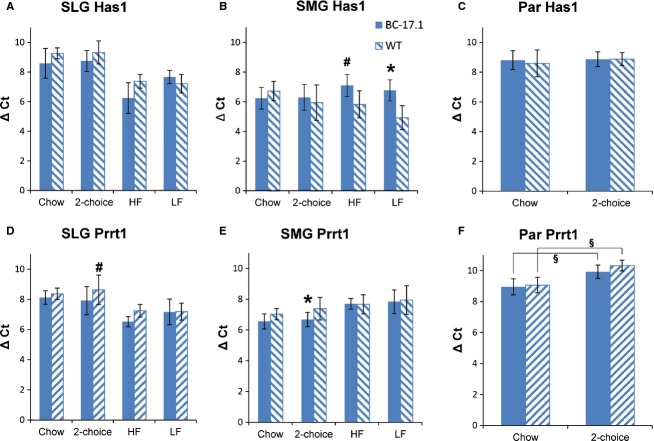
Figure 4.
Effect of genotype on Prrt1 and Has1 expression (ΔCT) in sublingual, submandibular, and parotid glands. For each experimental group, gene expression levels were determined by quantitative real-time PCR (see Tables5, 6). Statistical comparisons were made using the ΔCT values. Bar diagrams depict means and standard deviations. 2-choice indicates a choice between fat- and carbohydrate-rich diets. Genotype comparisons; *P < 0.01, #P < 0.05. Diet comparisons are illustrated by horizontal bars in F; §P < 0.001. n = 5–11.

