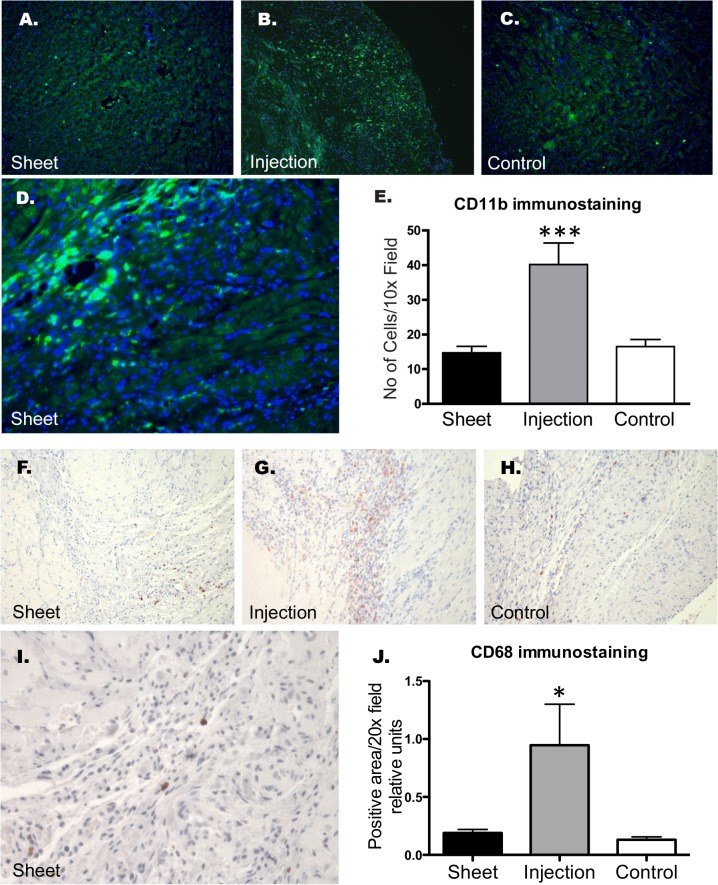
Fig 5. Panels A-C: Representative immunofluorescence images of CD11b-expression, with DAPI counterstaining of the nuclei of the myocardium 2 weeks after myoblast cell therapy (4 weeks after myocardial infarction).
Infiltration of CD11b-positive cells by epicardial transplantation (panel A) was similar to that of the Control group (panel C). Panel D: Clusters of CD11b-positive inflammatory cells can be seen in the myocardium of the Injection group at a higher magnification. Panel E shows densitometry quantitation of CD11b-expression in the various groups (n = 6). In the group receiving intramyocardial injections, an increased leukocyte infiltrate was evident in comparison to the Control or Sheet groups (*** p < 0.001 vs. Injection group). Panels F-I show CD68-staining similar to that of CD11b. Quantitation of the CD68-positive area showed increased CD68-positive cell infiltration in the Injection group in comparison to the Sheet and Control groups (panel J, * p < 0.05 for both comparisons).

