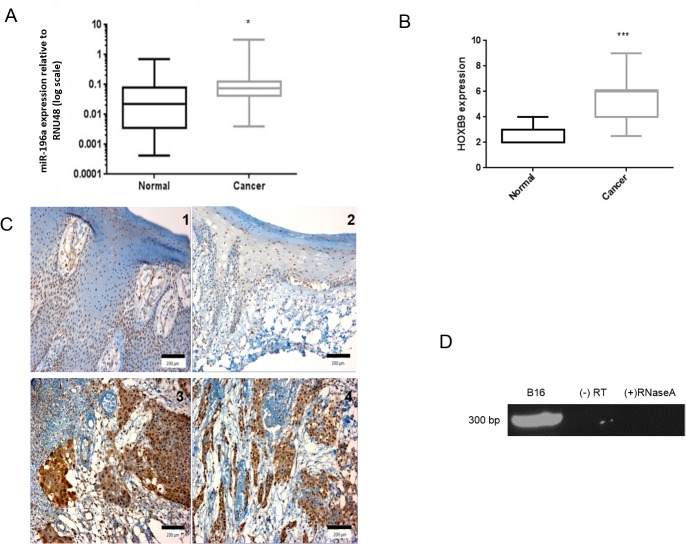
Fig 3. miR-196a and HOXB9 are up-regulated in HNSCC tissue samples.
3A-C. Expression of miR-196a (3A) and HOXB9 in tissues (3B, 3C) measured by qPCR of LCM tissues and immunohistochemistry, respectively. Representative photomicrographs show HOXB9 expression in normal tissue (C panels 1 and 2) and HNSCC (C panels 3 and 4). The HOXB9 expression in tissue was semi-quantitatively assessed using the Quickscore method. The pattern of expression correlates with in-vitro data and both are up-regulated in cancer tissue, albeit the fold change is less (3.4 fold for miR-196a). * p<0.05, ***p<0.001. Photomicrographs overall magnification x200, scale bar = 200μm. 3D. miR-196a-1 and HOXB9 are co-expressed on same novel primary transcript DNA agarose gel electrophoresis showing presence of 295 bp transcript after nested PCR. The transcript is present in B16 cell line and at the expected size. (-) RT: without reverse transcriptase control, (+) RNaseA: RNA treated with RNaseA at 37°C for 1 hour before cDNA production.

