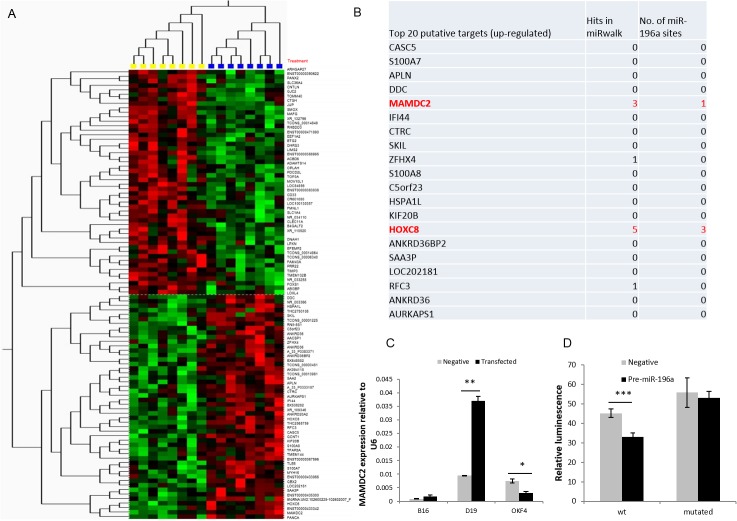
Fig 6. Prediction of putative targets of miR-196a in HNSCC-derived cell lines.
6A. Microarray Heat Map depicting top 50 miR-196a up-regulated and down-regulated genes. Yellow samples were compared against blue samples (high and low miR-196a expression respectively) using Qlucore Omics Explorer with T-test, p<0.01. Yellow box consists of B16 negative control, D19 negative control and OKF4 pre-miR-196a transfected cells whereas blue box consists of B16 anti-miR-196a, D19 anti-miR-196a and OKF4 negative control transfected cells. 6B. Table depicting top 20 up-regulated putative targets based on expression analysis and miRwalk analysis of potential miRNA targets. It also shows number of miR-196a binding sites present in 3’UTR of the gene (www.microRNA.org) 6C: The changes in MAMDC2 expression on transfection of anti-miR-196a were validated by qPCR in samples used in microarray. 6D: pMIR-REPORT luciferase vector was cloned with wild-type MAMDC2 3’UTR (wt) and the predicted miR-196a site in the 3’UTR was mutated by site-directed mutagenesis (mutated). These were co-transfected with negative control or pre-miR-196a, pRL-TK renilla luciferase control vector into B16 (HNSCC cells). The relative luminescence value (firefly/renilla value) of wt/pre-miR-196a was significantly lower than wt/negative control, with no significant difference in the mutated 3’UTR. *p<0.05, **p<0.01, ***p<0.001.

