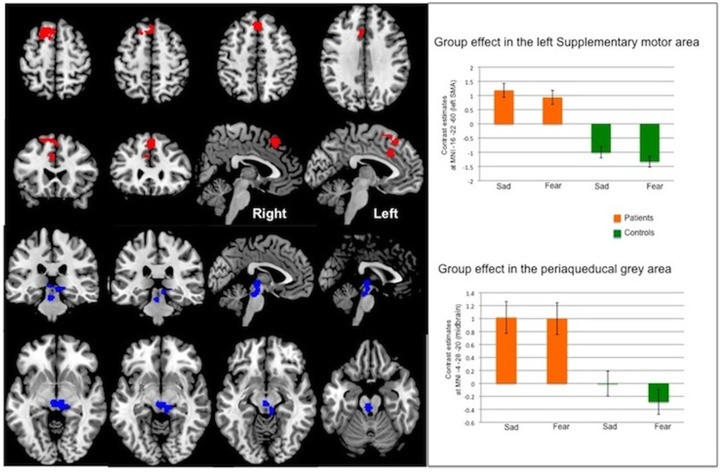
Fig 3. Whole-brain analysis: Group effect in the Emotion Model.
Statistical maps have been thresholded at p<0.001 uncorrected. Upper left panel: Activation in a frontal cluster showing a significant group effect (CD patients > healthy controls). Upper right panel: Plots of beta estimates at MNI [–16 22 60] (left supplementary motor area).Lower left panel: Activation in a midbain cluster (including the periaqueducal grey area) showing a significant group effect (CD patients > healthy controls). Lower right panel: Plots of beta estimates at MNI [–4–28–20] (midbrain).

