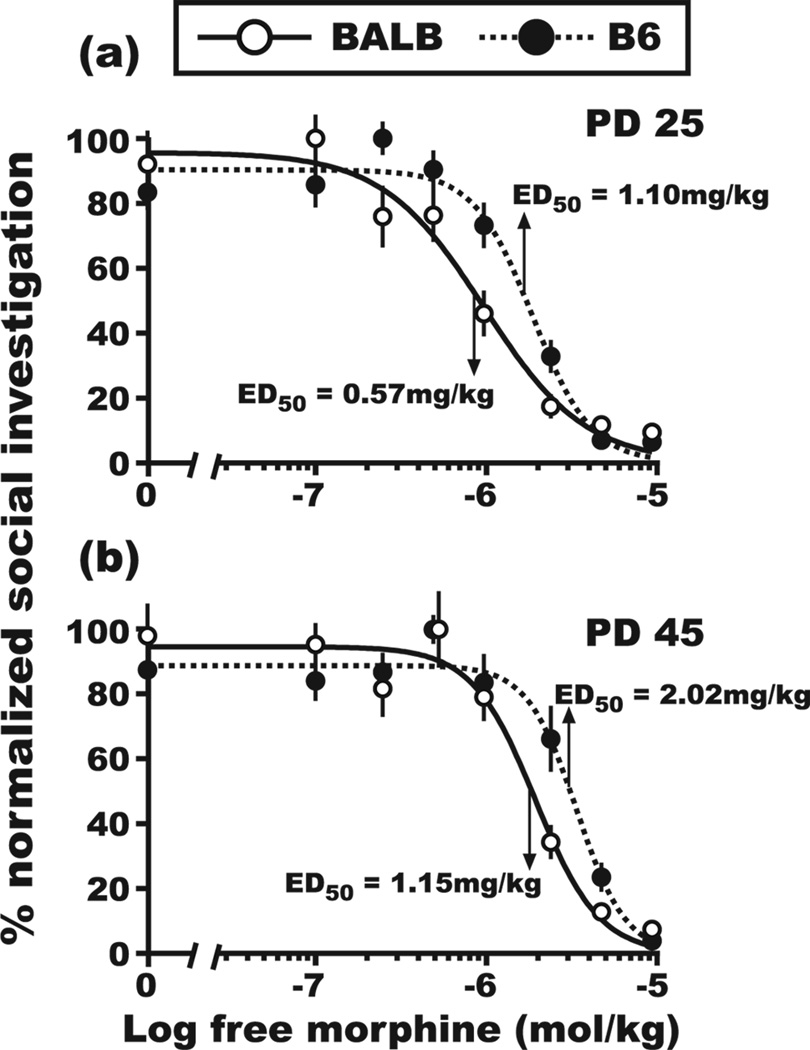
Figure 1. Dose-response curves for morphine-induced suppression of social investigation during mixed-sex social interactions.
Four-parameter, non-linear regression models were used to calculate the ED50 for morphine-induced suppression of SI during (a) early (PD 25) and (b) late (PD 45) adolescence for male BALB and B6 mice that were reunited with a female. SI values were normalized by assigning 100% to the maximum group mean for SI in each strain. SI values for the saline-injected group at PD 25 were 82 ± 9.2 s and 120 ± 7.9 s for BALB and B6 mice, respectively. SI values for the saline-injected group at PD 45 were 100 ± 10.1 s and 132 ± 10.3 s for BALB and B6 mice, respectively. The ED50 values for BALB and B6 mice were significantly different at each of the two developmental time points. Morphine doses are reported with the sulfate conjugate subtracted from the active compound. Inter-rater reliability, rp = 0.96, d.f. = 331. All SI data are reported as the mean ± SEM.

