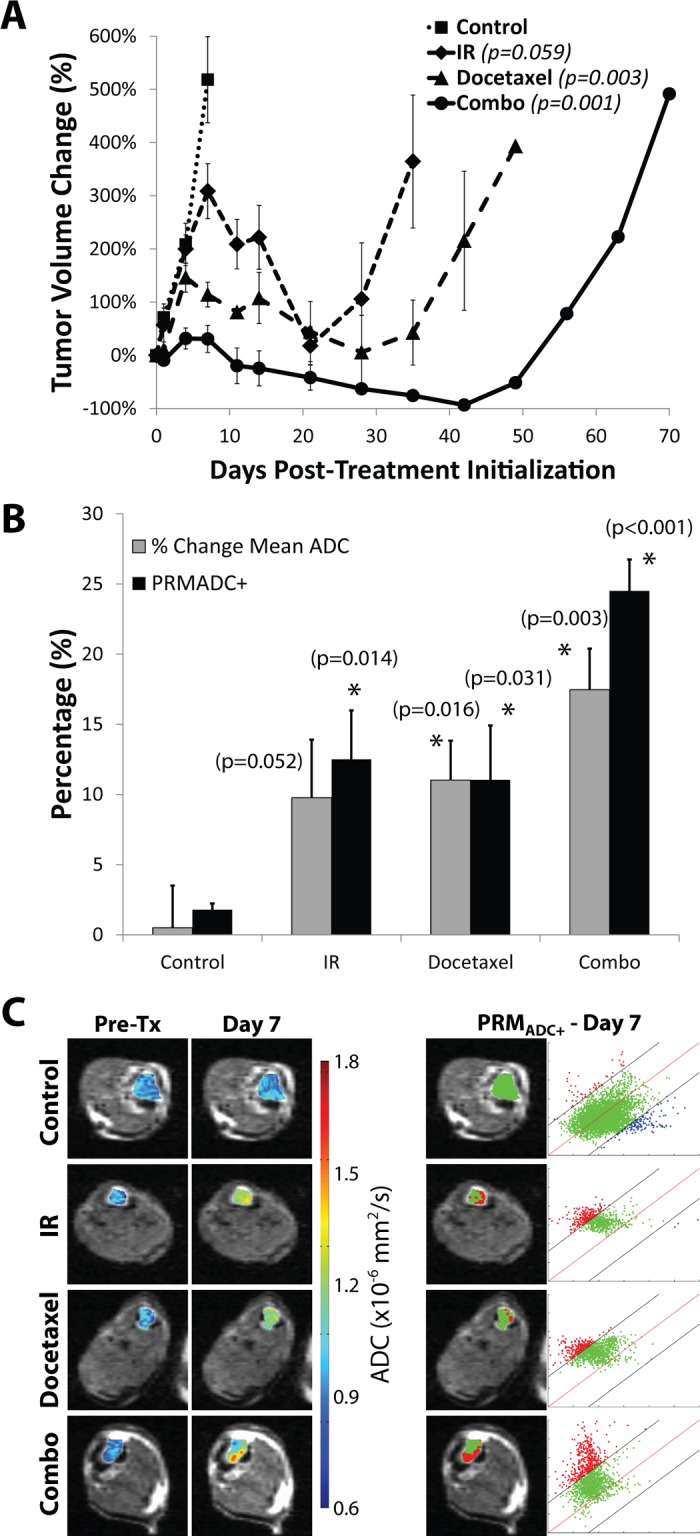
Fig 2. Intratibial PC3 tumor response to docetaxel (n = 6), radiation (IR, n = 6), or combination treatment (n = 6) shows an additive effect by anatomical and diffusion MRI compared to controls (n = 8).

(A) Tumor volumes plotted over time (p-values in legend show significance versus controls at day 7) show greater cell kill in the combination group (circles, solid line) than either docetaxel (triangles, long-dashed line) or IR (diamonds, short-dashed line) treatment alone, and all treatments resulted in significant cell kill over controls (squares, dotted line). (B) Comparison of mean ADC change to PRMADC+ at day 7 post-treatment-initialization resulted in no significant difference between measurements, but slightly elevated PRMADC+ over mean ADC in the combination treatment (significant difference from controls: * (p<0.05)). (C) ADC color over overlays are shown in the left two columns for pre-treatment and day 7, and corresponding PRMADC overlay and scatterplot are shown on the right.
