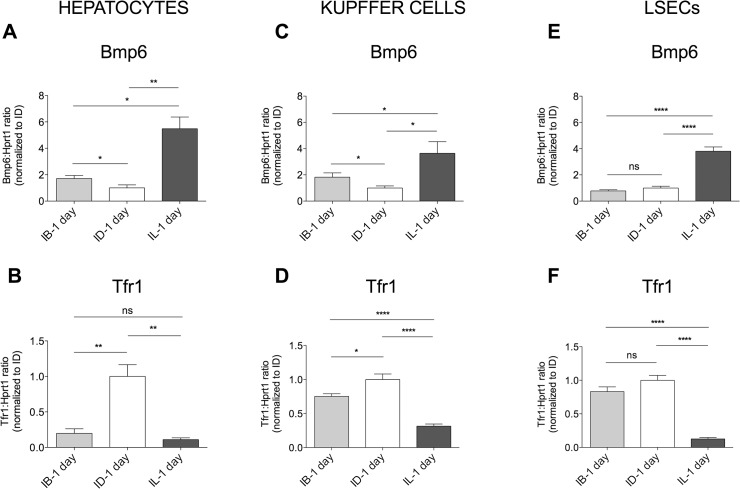
Fig 4. Bmp6 and Tfr1 expression levels in acute dietary iron changes.
Bmp6 (A, C, E) and Tfr1 (B, D, F) mRNA expression was evaluated by qRT-PCR in HCs (A, B), KCs (C, D) and LSECs (E, F) isolated from 4–7 mice/group. Hprt1 was used as housekeeping gene. mRNA expression ratio was normalized to control (ID-1 day) mean value set to 1. Error bars indicate SE. *: P<. 05; **: P<. 01; ***: P<. 001; ns: not significant.

