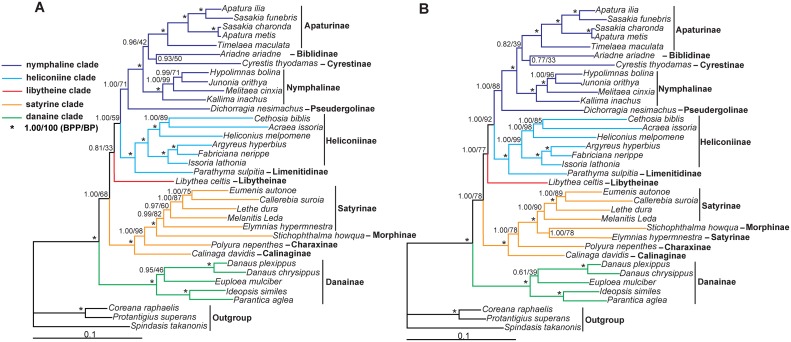
Fig 4. Phylogenetic relationships among 33 nymphalid species.
(A) Bayesian Inference and maximum likelihood phylogram obtained with the D1 dataset, which is divided into 13 partitions (D1-P13). (B) Bayesian Inference and maximum likelihood phylogram obtained with the D2 dataset, which is divided into 15 partitions (D2-P14). Numbers on each node correspond to the posterior probability values of the BI analysis (left) and the ML bootstrap percentage values for 1 000 replicates of ML analysis (right).

