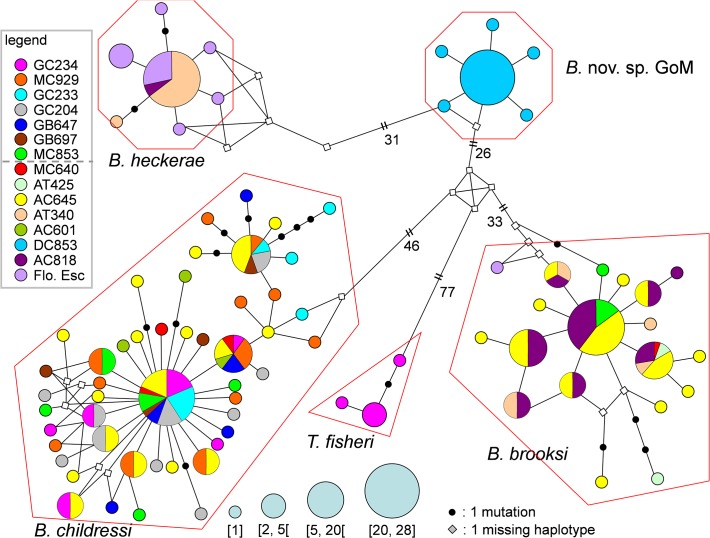
Fig 3. Median-joining network showing genetic structure of the five species of bathymodiolin mussels from the GoM (Bathymodiolus heckerae, B. childressi, B. brooksi, B. nov. sp. GoM and Tamu fisheri) (CO1 data only).
Size of the haplotype circle are proportional to their frequencies (Unique (n = 1); rare (n = 2 to 4), common (n = 5 to 20) and abundant (n = 20 to 28). Black points represent mutations. Diamonds represent missing haplotype. Colours represent locations were the haplotype was found. In the legend, the dashed line represents the virtual limit between “shallow population (less than or about 1000m deep) and deep populations (more than 1400m deep). The number of sequences used for each species and population is indicated on Table 1.

