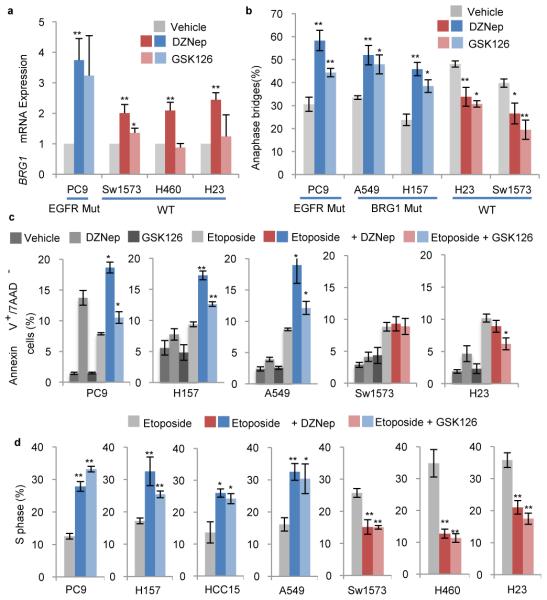
Figure 3. Dual EZH2i and TopoIIi differentially affects cell cycle, apoptosis and anaphase bridging.
a, RT-qPCR for BRG1 levels +/− s.e.m. in indicated cell lines in response to 4 days of 1μM DZNep or 10μM GSK126, n=6 biological replicates for DZNep, n=3 biological replicates for GSK126, * P<0.05, ** P<0.008. b, Percentage of anaphase structures with bridges +/− s.e.m. in vehicle-, DZNep- treated or GSK126-treated cell lines, n≥3 biological replicates and indicated in Methods, * P<0.04, ** P<0.02. c, Annexin V+/7AAD− cells +/− s.e.m. quantified by flow cytometry on cell lines cultured with indicated treatments for 3 days, n=4 biological replicates, * P<0.03, ** P<0.001 for Etop vs Dual treated or DZNep vs Dual treatment for PC9. d, 7-AAD cell cycle flow cytometry was performed on cell lines with or without 5μM etoposide or 1μM DZNep for 4 days. The average % S phase +/− s.e.m. of each culture is plotted, n=3 biological replicates for HCC15, A549, PC9 and H23, n=4 biological replicates for H157 and Sw1573, * P<0.05 ** P<0.009.

