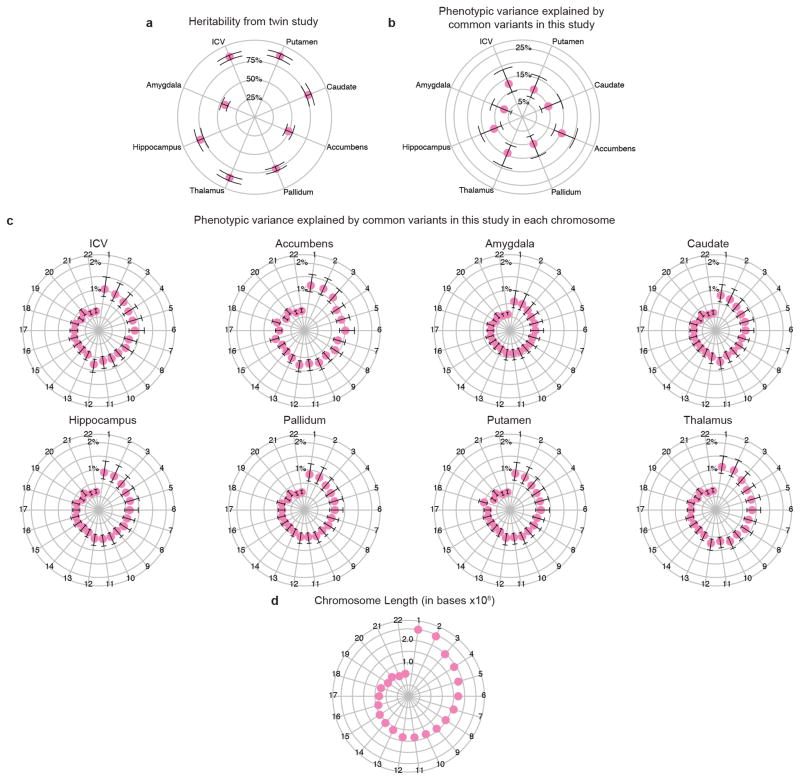
Extended Data Figure 11. The phenotypic variance explained by all common variants in this study.
a, Twin-based heritability (with 95% confidence intervals), measuring additive genetic influences from both common and rare variation, is shown for comparison with common variant based heritability (see Methods). b, The median estimated percentage of phenotypic variance explained by all SNPs (and 95% confidence interval) is given for each brain structure studied41. The full genome-wide association results from common variants explain approximately 7–15% of variance depending on the phenotype. c, The median estimated variance explained by each chromosome is shown for each phenotype. d, Some chromosomes explain more variance than would be expected by their length, for example chromosome 18 in the case of the putamen, which contains the DCC gene.

