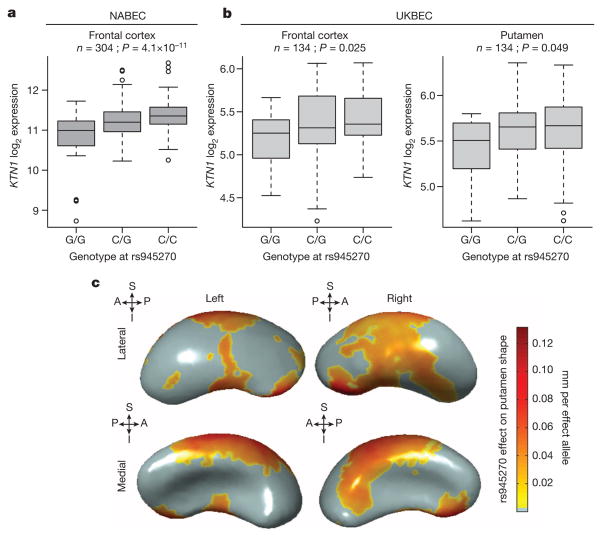
Figure 2. Effect of rs945270 on KTN1 expression and putamen shape.
a, b, Expression quantitative trait loci study in brain tissue demonstrates the effect of rs945270 on KTN1 gene expression in frontal cortex tissue from 304 subjects from the North American Brain Expression Cohort (NABEC25) (a) and in an independent sample of 134 subjects from the UK Brain Expression Cohort (UKBEC) (b), sampled from both frontal cortex and putamen. Boxplot dashed bars mark the twenty-fifth and seventy-fifth percentiles. c, Surface-based analysis demonstrates that rs945270 has strong effects on the shape of superior and lateral portions of the putamen in 1,541 subjects. Each copy of the rs945270-C allele was significantly associated with increased width in coloured areas (false discovery rate corrected at q = 0.05), and the degree of deformation is labelled by colour, with red indicating greater deformation. Orientation is indicated by arrows. A, anterior; I, inferior; P, posterior, S, superior.

