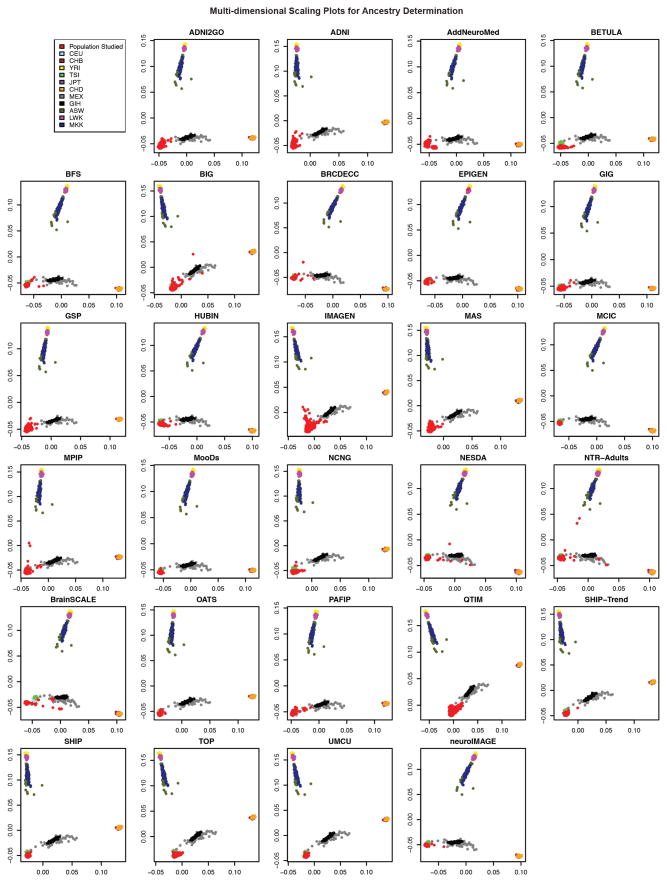
Extended Data Figure 2. Ancestry inference via multi-dimensional scaling plots.
Multi-dimensional scaling (MDS) plots of the discovery cohorts to HapMap III reference panels of known ancestry are displayed. Ancestry is generally homogeneous within each group. In all discovery samples any individuals with non-European ancestry were excluded before association. The axes have been flipped to the same orientation for each sample for ease of comparison. ASW, African ancestry in southwest USA; CEU, Utah residents with northern and western European ancestry from the CEPH collection; CHD, Chinese in metropolitan Denver, Colorado; GIH, Gujarati Indians in Houston, Texas; LWK, Luhya in Webuye, Kenya; MEX, Mexican ancestry in Los Angeles, California; MKK, Maasai in Kinyawa, Kenya; TSI, Tuscans in Italy; YRI, Yoruba in Ibadan, Nigeria.

