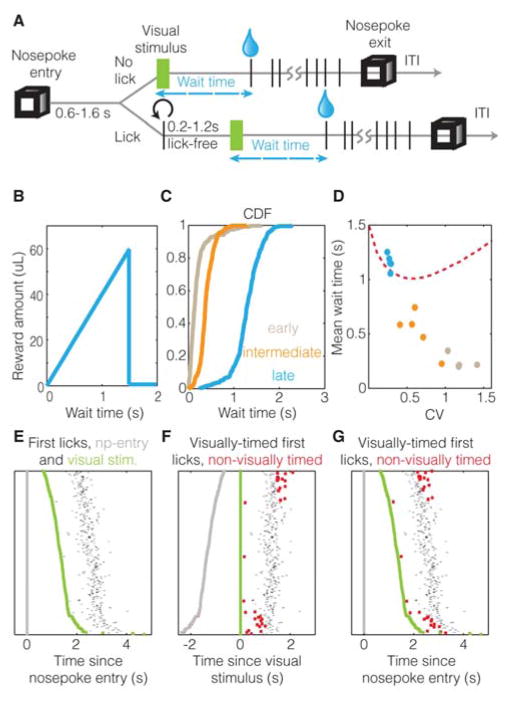
Figure 1. Visually-cued timing behavior.
A & B. Visually-cued timing task, showing that the time waited by an animal from the visual stimulus onset until the first lick (“wait time”) determines the reward obtained (see Experimental Procedures). C & D. Example performance of animals at early (brown), intermediate (orange) and late (cyan) stages of learning, shown using cumulative-distribution-functions (CDF) (C) and a population plot (D) of asymptotic coefficient of variation (CV) with mean wait time (5 animals each). Red dotted line shows optimal behavior (see Figure S1). E–G. Raster plots showing relation between delay from nosepoke-entry (grey) to visual stimulus (green), to the corresponding first licks (black dots), when aligned to nosepoke entry (E, G) and visual stimulus (F). Non-visually-timed trials (see text) are shown in red. This is the session in which the neuron showed in Figure 3A was recorded.

