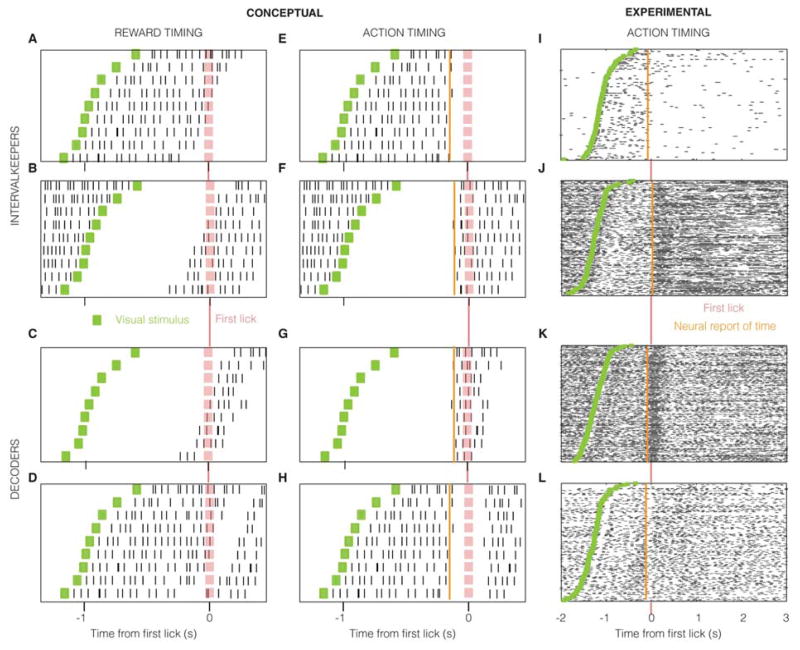
Figure 2. Raster plot showing conceptual and observed neural responses.
Shown for example neurons that measure the passage of a target interval (A, B, E, F, I, J) from a visual stimulus (green) and those that indicate its expiry (C, D, G, H, K, L). The target interval measured by intervalkeepers (and thus reflected by decoders) shows trial-by-trial variability, which is consequently reflected by the action of first lick (pink). The neural report of time is defined as the earliest moment when neural activity conveys information about the action. The values for “Conceptual” neurons are merely illustrative, whereas those for the experimental neurons are quantified using the methods described in Experimental Procedures.

