
Figure 4. Population analysis of single unit data.
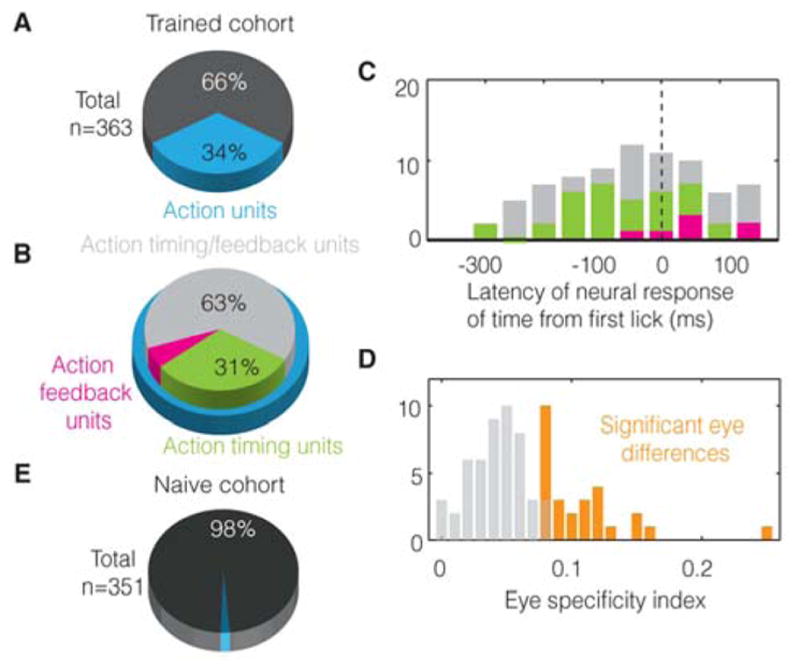
A. 122 out of 363 units recorded from 5 trained animals show trial-by-trial correlations with action and are labeled as “action units” (see Experimental Procedures). B. Of these, 31% can be definitively classified as action timing and 6% as action feedback (see text). The others are likely action timing units but cannot be definitively classified due to the low number of non-visually timed licks performed by trained animals (see text). C. Histogram showing the earliest moment at which units contain information about the action. D. 29 out of 77 action timing/feedback units show a significant difference in the action response for both eyes (orange) (see text). E. Only 2% units show significant correlations with action early in training, reflecting the false positive rate of our statistical test.