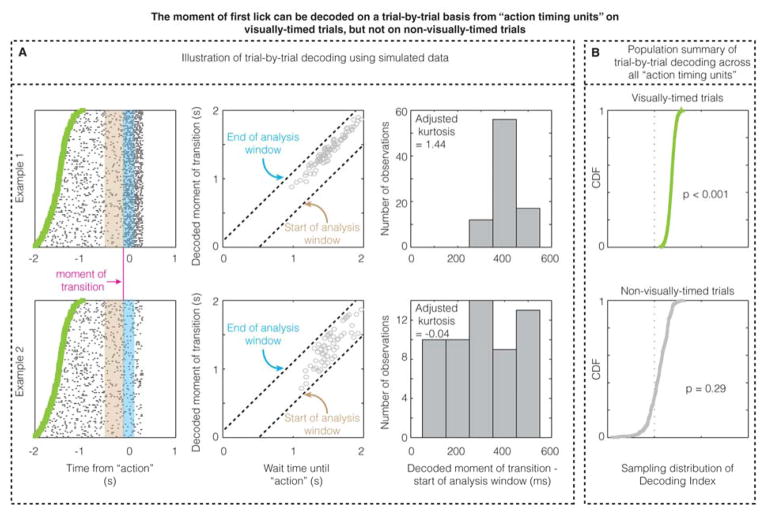
Figure 5. The moment of first lick can be decoded on a trial-by-trial basis from “action timing units” on visually-timed trials, but not on non-visually-timed trials.
A. The three columns illustrate the single-trial decoding method using simulated data from two example units (shown in each row), one of which actually contains a transition in firing rate that predicts the moment of the action (100 ms prior to the action; “moment of transition”), while the other contains no transition in firing rate. The decoder calculates the maximum likelihood estimate of transition within an analysis window (Figure S5) for a given trial after being trained on the other trials to calculate the expected firing rates before (in the mauve bin) and after (in the cyan bin) transition (Figure S5). When there is a real transition from which the action time can be decoded, the decoded moments of transition across trials form a peaked, non-uniform distribution (example 1), whereas when there is no real transition from which the action time can be decoded (null hypothesis), the decoded moment of transition forms a uniform distribution within the analysis window. B. The CDF of the sampling distribution of Decoding Index (see Experimental Procedures and Figure S5) across all “action timing units” for visually-timed and non-visually-timed licks. These CDFs show that the action time can be decoded on a trial-by-trial basis on visually-timed trials, but not on non-visually-timed trials.

