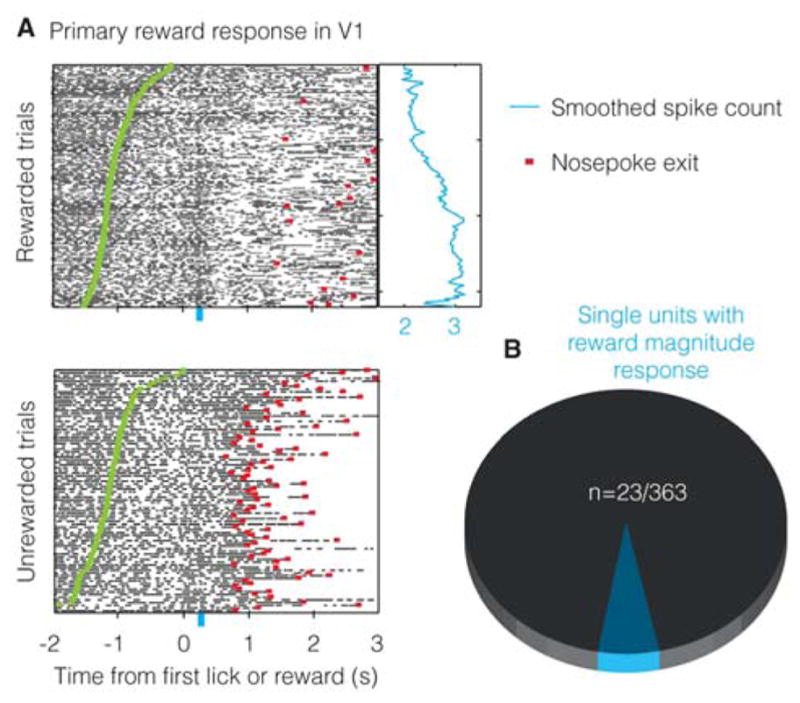
Figure 8. Reward magnitude response observed in V1.

A. Example unit showing a response indicating the receipt of reward of a given magnitude (larger the wait time, larger the reward obtained). Blue curve shows smoothed spike counts (during 200–300ms following first lick and reward; shown by the blue bar) for individual trials. B. 23/363 units show reward magnitude coding.
