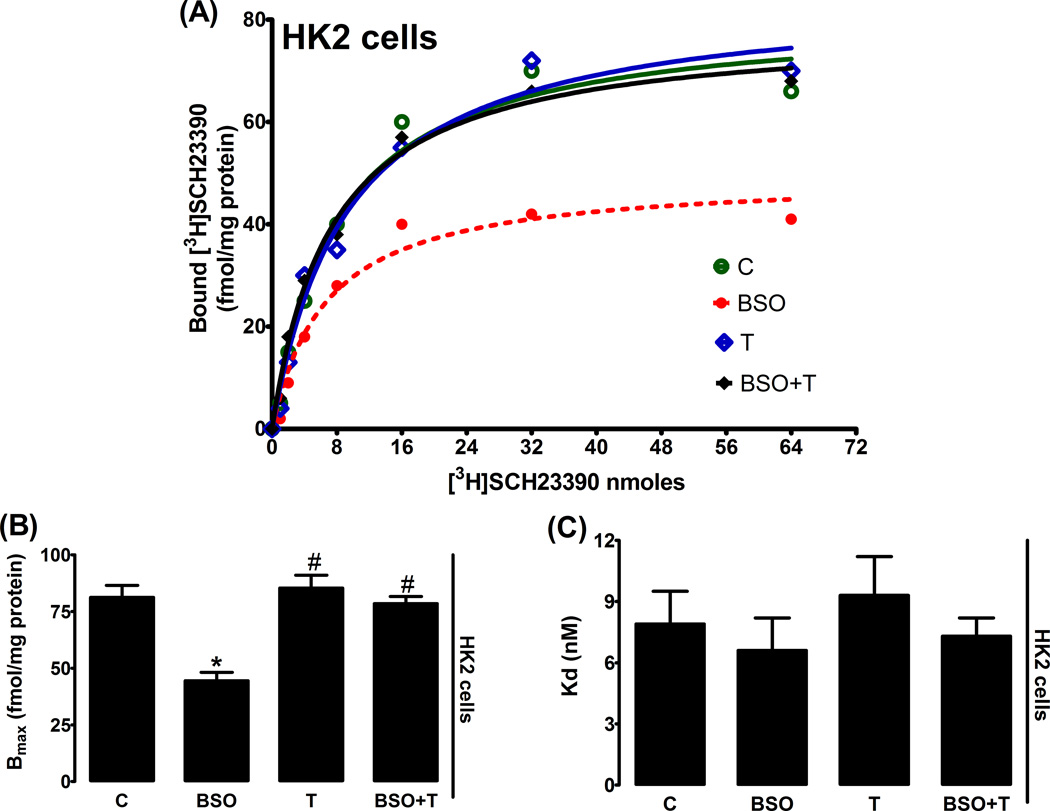
Figure 3.
Membrane dopamine D1 receptor (D1R) expression in HK2 cells. A representative dose response curve of D1R antagonist [3H]SCH23390 in HK2 membranes (A). Bmax and Kd obtained from Scatchard plot (B and C). Experiments were performed in triplicate and data represents Mean ± SE from 4–6 cell passages (cells from passage 2–8). *P<0.05 vs C and #P<0.05 vs BSO.

