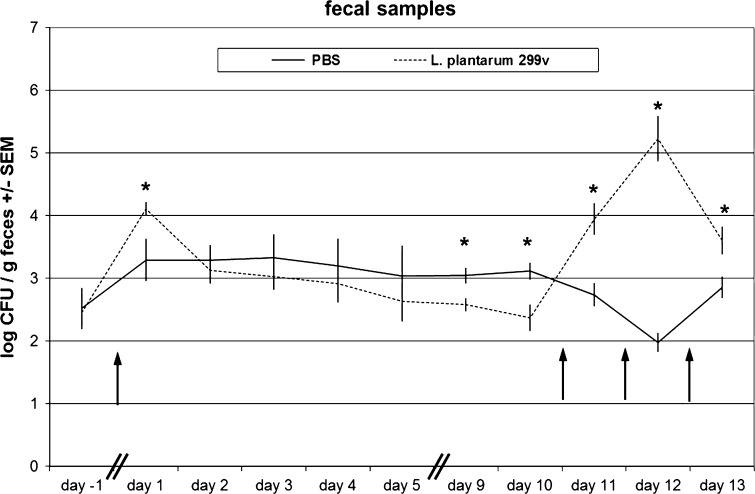
Fig. 1.
Average faecal excretion of rifampicin-resistant bacterial counts (expressed in log10 CFU ± SEM L. plantarum/g faecal sample) per experimental group of animals (n = 8), either administered with PBS (control; black line), or L. plantarum 299v (dotted line). Arrows indicate the time points of oral administration of bacterial suspensions (at the beginning of day 0, and at the end of day 10, 11 and 12). *Significantly different from PBS group (t test p < 0.05)

