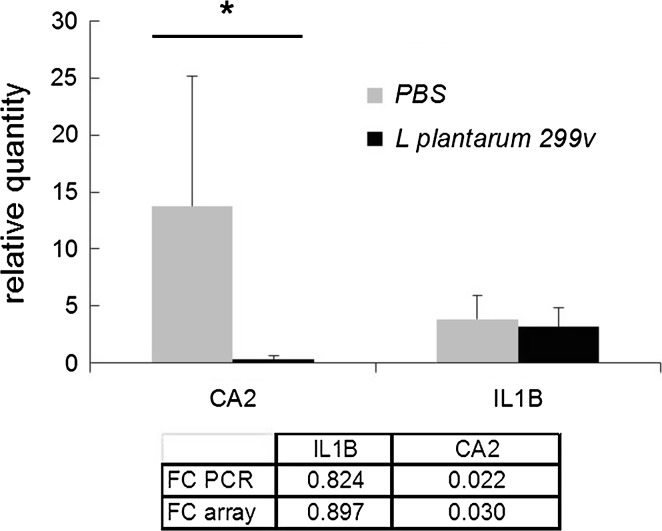
Fig. 2.
Quantification of IL1B and CA2 mRNA by QRT-PCR. Graph: Average of the relative concentration of mRNA measured in the ileum of pigs (n = 8) treated with L. plantarum 299v or treated with PBS. Error bars represent the STDEV (n = 8). Table: ratio of expression (FC, L. plantarum over PBS) measured on the microarray and by PCR. *Significantly different from PBS group (t test p < 0.05)

