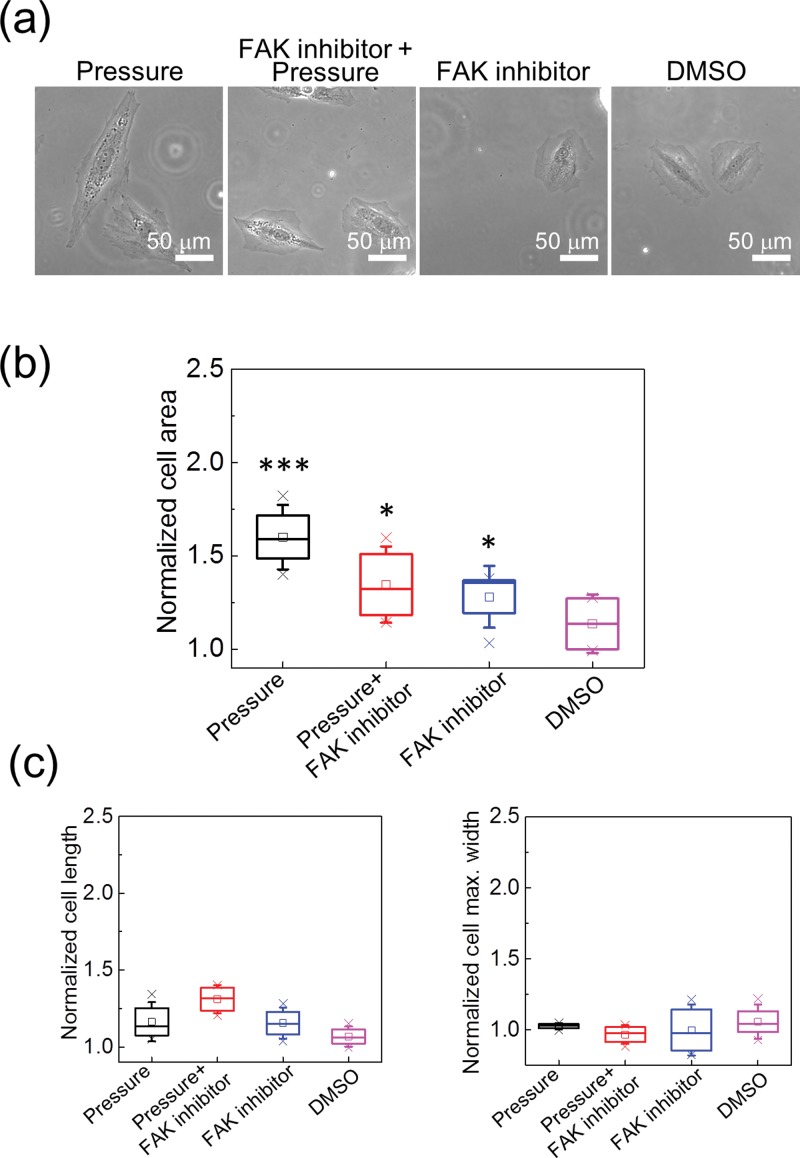
FIG. 4.
(a) Phase contrast images of the H9c2 cells under various treatments. (b) The cellular areas of the H9c2 cells under various treatments. All values are normalized to those obtained from cells in the control group. The cellular areas were significantly increased by the 170 mm Hg hydraulic pressure, and the FAK inhibitor suppressed the influence from the pressure. However, the FAK inhibitor also caused the enlargement of the cellular area. The data were from five repeated experiments. In each experiment, more than 15 cells were measured. *p < 0.05 and ***p < 0.005, in comparison with the control group. (c) The cell lengths and maximum cell widths under various treatments. Because the increases in both the cell lengths and widths were smaller than that in the cell area, we confirmed that the hydraulic pressure actually enlarged the cell area isotropically rather than increasing the cell lengths or widths only.

