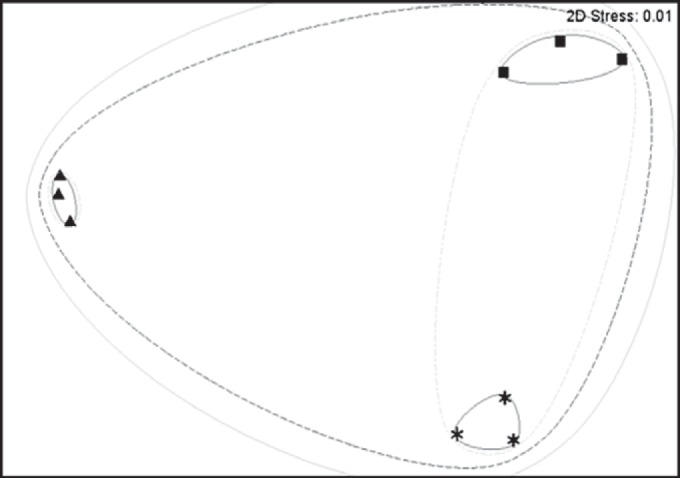
FIG 3.

MDS analysis of a Bray-Curtis similarity matrix of functional assembly profiles for each station. Triangles represent station 973, squares represent station 882, and asterisks represent station 1163. The outer continuous gray line indicates 50% similarity, the outer dashed black line represents 75% similarity, the inner dashed gray lines indicate 90% similarity, and the inner solid gray lines represent 95% similarity between samples. 2D, two dimensional.
