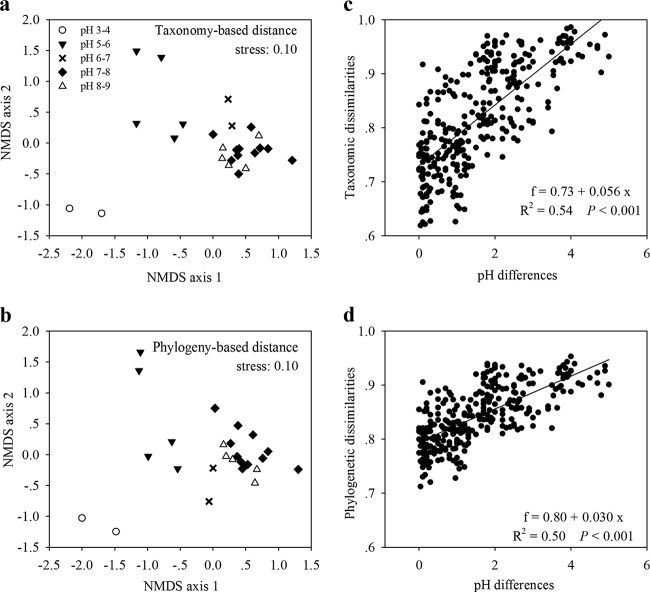
FIG 3.
(a and b) NMDS plots derived from the taxonomy-based Bray-Curtis distance (a) and the phylogeny-based UniFrac distance (b), with symbols showing pH categories. (c and d) Relationships between pH differences and the taxonomic (Bray-Curtis) (c) and phylogenetic (UniFrac) (d) dissimilarities of lakes compared pairwise. Substantial heterogeneity in BCC was observed between different pH groups (pH 3 to 4, 5 to 6, 6 to 7, and 7 to 9). The taxonomic and phylogenetic BCC dissimilarities between lakes increased with increasing pH differences. The formulas, R2 values, and significances are given in each panel.

