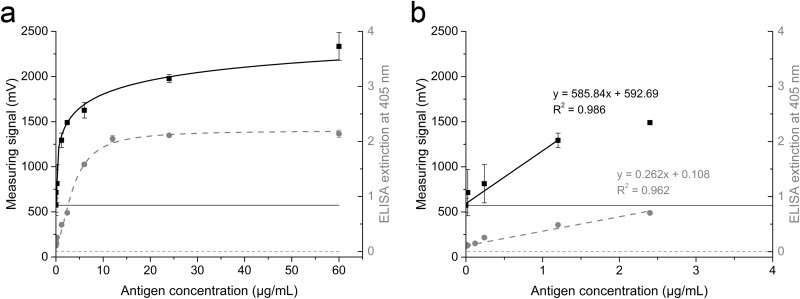
FIG 4.
(a) Comparison of magnetic immunoassay (squares, left y axis) and a standard double-antibody sandwich ELISA (circles, right y axis) using identical serial dilutions of positive-control material containing GFLV particles. Data points were fitted to the Hill-1 curve. Blank values are indicated by a solid line (magnetic immunoassay) and a dotted line (ELISA). (b) Linear range with the corresponding linear fit equation and coefficient of determination (R2). Data are shown as means ± SDs (n = 3).

